In today’s fast-moving digital landscape, analytics & reporting are no longer optional for marketers. They are the foundation of every smart business decision. Whether you manage paid ads, organic SEO, or social media campaigns, the data you collect and how you visualise it determines how effectively you can improve performance.
Without proper dashboards, even the best data-driven marketing strategy falls apart. Marketers drown in spreadsheets, miss trends, and fail to justify spend to leadership. The good news? You don’t need to be a data scientist. You need the right dashboard structure, the right KPIs, and a clear understanding of your funnel strategy.
Why Analytics & Reporting Are the Backbone of Data-Driven Marketing
Most marketing teams collect data. Far fewer actually use it. The gap between collecting data and acting on it is where most campaigns lose money. Analytics and reporting close that gap.
When you build a structured reporting system, you move from guessing to knowing. You stop asking ‘What should we try?’ and start asking ‘What does the data tell us to do next?’ That shift defines data-driven marketing.
The Core Problem: Data Without Context
Raw data without a framework produces noise, not insight. A 5% drop in website traffic could mean a seasonal dip, a technical issue, a Google algorithm update, or a competitor surge. Without a proper reporting layer, you won’t know which.
This is why linking your analytics setup with a rigorous technical SEO audit matters. Technical issues slow pages, broken crawls, indexing errors often show up in your analytics as sudden drops before you ever know there is a problem.
What Makes a Great Marketing Dashboard?
A great dashboard is not the one with the most charts. It is the one that helps the right person answer the right question in under 60 seconds. Here is what separates functional dashboards from exceptional ones.
Key Principles of an Effective Dashboard
- Single source of truth — all data pulled from integrated, verified sources
- Audience-specific views — what a CMO needs differs from what a paid ads manager needs
- Real-time or near real-time updates — decisions cannot wait for weekly reports
- Clear hierarchy — headline KPIs first, supporting data second
- Actionability — every metric should connect to something you can change
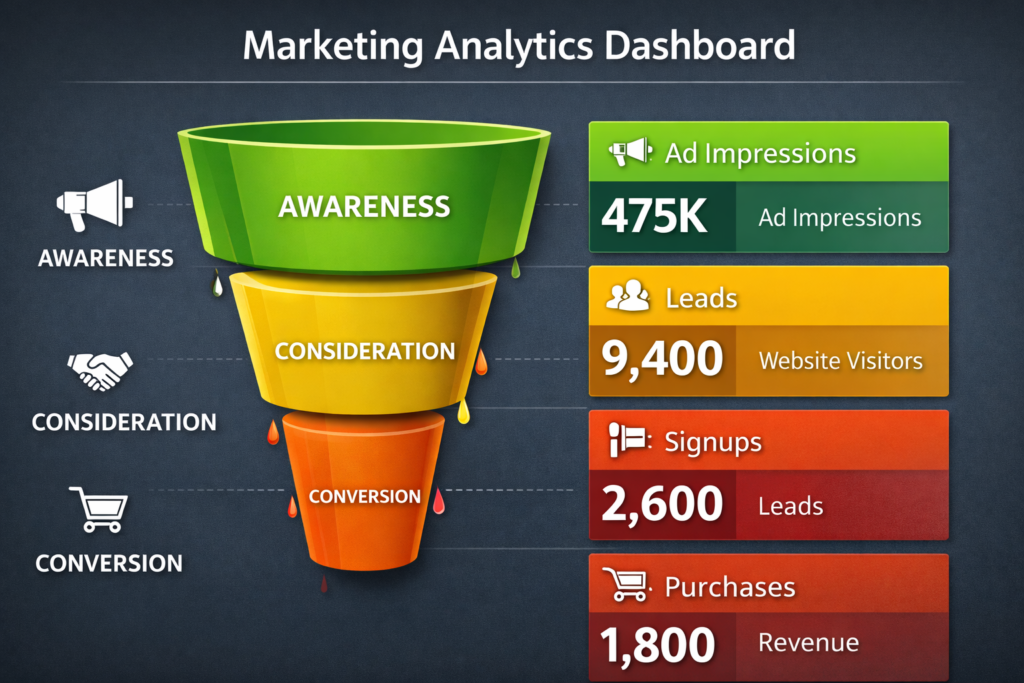
A well-designed dashboard supports your entire funnel strategy. It maps data to each funnel stage awareness, consideration, decision, and retention so you can identify exactly where users drop off and where to double down.
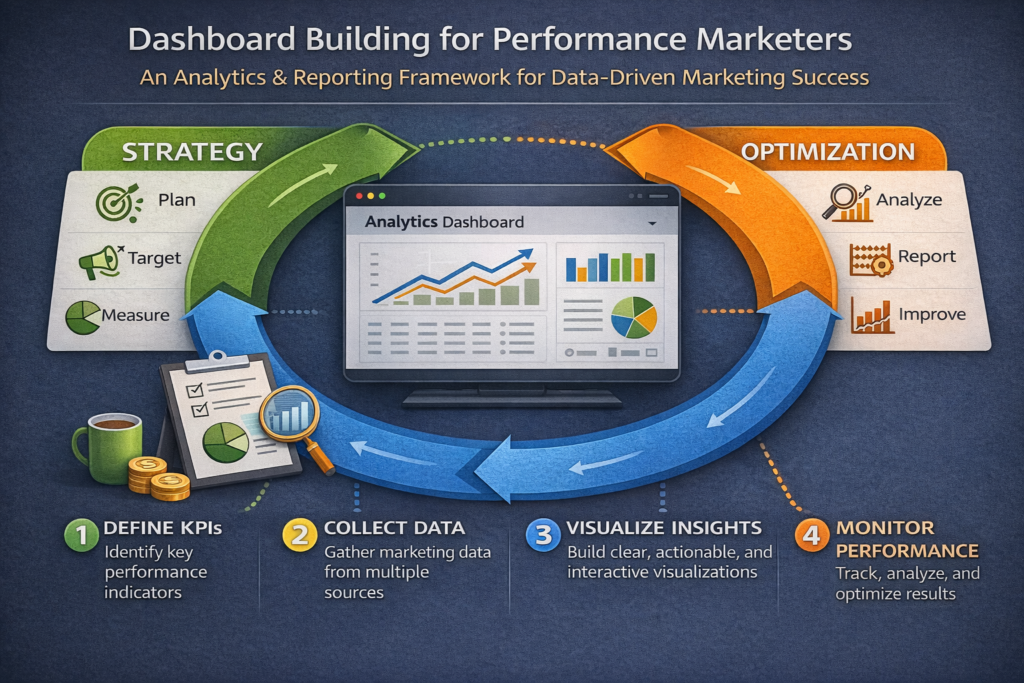
Step-by-Step: How to Build a Dashboard That Drives Decisions
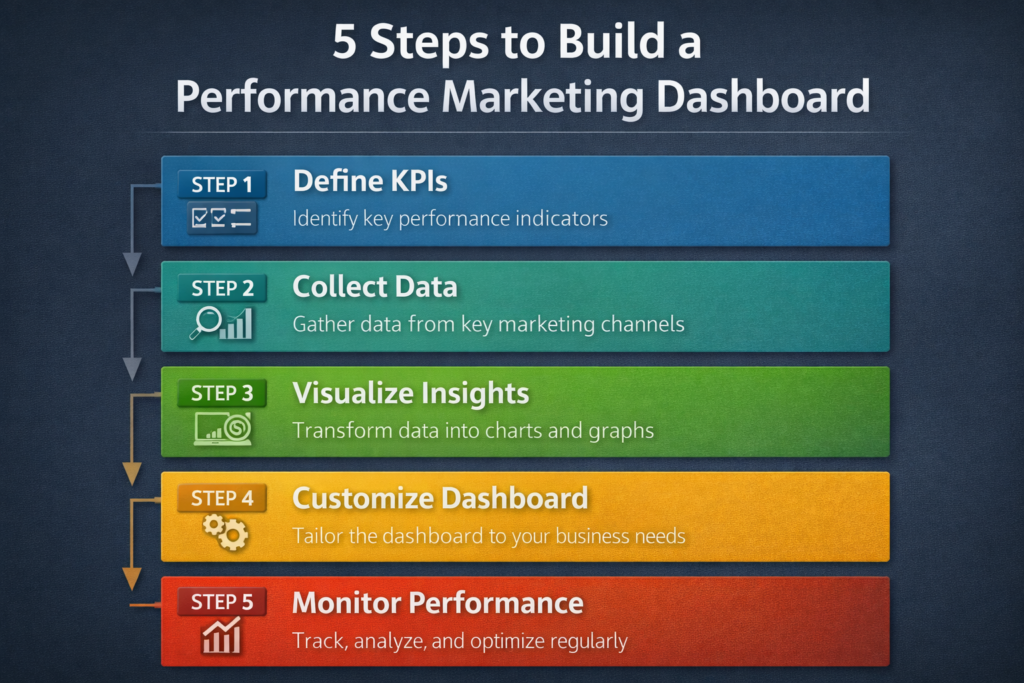
Building your analytics & reporting dashboard from scratch does not require expensive tools. What it requires is a disciplined process. Follow these steps.
Step 1: Define Your Goal Before Picking Any Tool
Before you open Google Data Studio, Looker, or any platform, define what question your dashboard must answer. Examples:
- “Which channel is driving the most qualified leads this month?”
- “Where in the funnel are users abandoning most?”
- “Which landing page has the best conversion rate from paid traffic?”
Your question shapes your metrics. Your metrics shape your layout.
Step 2: Identify Your KPIs by Funnel Stage
Funnel strategy alignment is non-negotiable for performance marketers. Use this framework:
| Funnel Stage | Key Metrics | Dashboard Purpose |
| Awareness | Impressions, Reach, CTR | Track visibility and brand exposure |
| Consideration | Sessions, Bounce Rate, Time on Page | Understand engagement quality |
| Decision | Conversions, CPA, ROAS | Measure campaign efficiency |
| Retention | Repeat Visits, LTV, Churn Rate | Optimise for long-term growth |
Step 3: Choose the Right Analytics Tools
Tool selection should follow your goals, not the other way around. For most marketing teams, a combination of Google Analytics 4, Google Search Console, Looker Studio (formerly Data Studio), and your ad platform’s native reporting covers 90% of needs.
If your site has performance issues, make sure you review Core Web Vitals optimisation as page speed directly affects bounce rate, session quality, and therefore the accuracy of your funnel data.
Step 4: Structure Your Dashboard Layout
Organise your dashboard into three tiers:
- Headline view — 3 to 5 top KPIs visible immediately (revenue, leads, ROAS, top channel)
- Channel breakdown — performance by source (organic, paid, email, social)
- Deep dive — page-level, campaign-level, and audience-level data for analysis
Step 5: Automate Your Reporting Cadence
Manual reporting is a time drain. Use SEO automation principles to schedule automated reports, trigger alerts for anomalies (sudden traffic drops, CTR spikes), and push weekly summaries to your team without lifting a finger.
Analytics & Reporting for Performance Marketing: What to Track
Performance marketing is laser-focused on measurable outcomes. Every rupee or dollar spent must be accountable. Your reporting dashboard must therefore track:
Paid Channel Metrics
- Click-Through Rate (CTR) — are your ads compelling enough?
- Cost Per Click (CPC) — how efficiently are you buying traffic?
- Return on Ad Spend (ROAS) — what revenue are you generating per spend?
- Conversion Rate by Campaign — which campaigns close the most deals?
- Cost Per Acquisition (CPA) — what does it cost to acquire one customer?
Organic & SEO Metrics
Your paid data is only half the picture. Organic performance fills the gap. Track keyword rankings, organic sessions, and featured snippet performance. If you are not sure whether your SEO is working, review how to know if your SEO is working it provides a practical checklist you can map directly to your dashboard KPIs.
- Organic sessions by keyword cluster
- Impressions and average position (Search Console)
- Top landing pages by organic traffic
- Pages with high impressions but low CTR your optimisation opportunities
Content Performance Metrics
Content is a core driver of both SEO and funnel strategy. Your content metrics should include scroll depth, time on page, and assisted conversions. Understanding the right content length helps you create pages that hold attention and that engagement shows up in your dashboard as higher session quality and lower bounce rates.
Advanced Dashboard Techniques for Serious Marketers
Once your core dashboard is running, move to advanced techniques that separate good marketers from great ones.
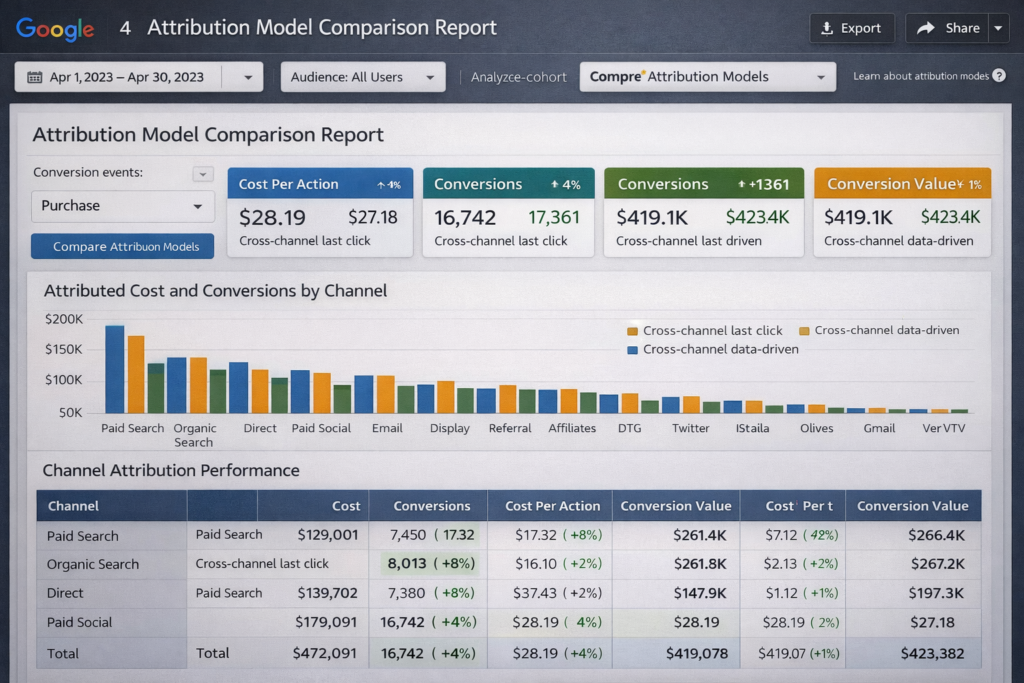
Attribution Modelling
First-click and last-click attribution models lie. A user may see your brand on Instagram, read a blog post via organic search, click a retargeting ad, and then convert via email. Which channel gets credit? Use data-driven attribution (available in GA4) to distribute credit fairly across touchpoints.
Cohort Analysis for Retention
Cohort analysis groups users by the time they first visited or converted. It tells you whether your retention is improving over time invaluable for subscription businesses, ecommerce, and SaaS.
Schema Markup to Enrich Search Data
Advanced marketers also improve the data they receive from search by implementing structured data correctly. Schema markup enables rich snippets star ratings, FAQs, product prices in search results. These snippets improve CTR, which shows up in your performance data as improved organic quality scores.
Site Speed as a Conversion Metric
Slow pages destroy conversions silently. A 1-second delay can reduce conversions by 7%. Always include page speed in your dashboard specifically Largest Contentful Paint (LCP) and Cumulative Layout Shift (CLS). For a full guide, see site speed optimisation for more revenue.
Common Dashboard Mistakes That Kill Marketing Decisions
Even experienced marketers make these mistakes. Avoid them.
- Too many metrics: Vanity metrics inflate reports but add no decision value. Cut ruthlessly.
- No segment separation: Blending all traffic sources hides which channels actually work.
- Ignoring mobile vs desktop splits: Conversion rates often differ dramatically between devices.
- No benchmark or target line: A number without context is just a number. Always show a target.
- Outdated data connections: Broken API connections silently kill your dashboard. Audit connections monthly.
If your site needs a broader health check, run a technical SEO audit. A site with technical errors pollutes analytics data crawl errors, redirect chains, and duplicate content all skew your numbers.
Digital Marketing Strategy & Analytics: Making It All Work Together
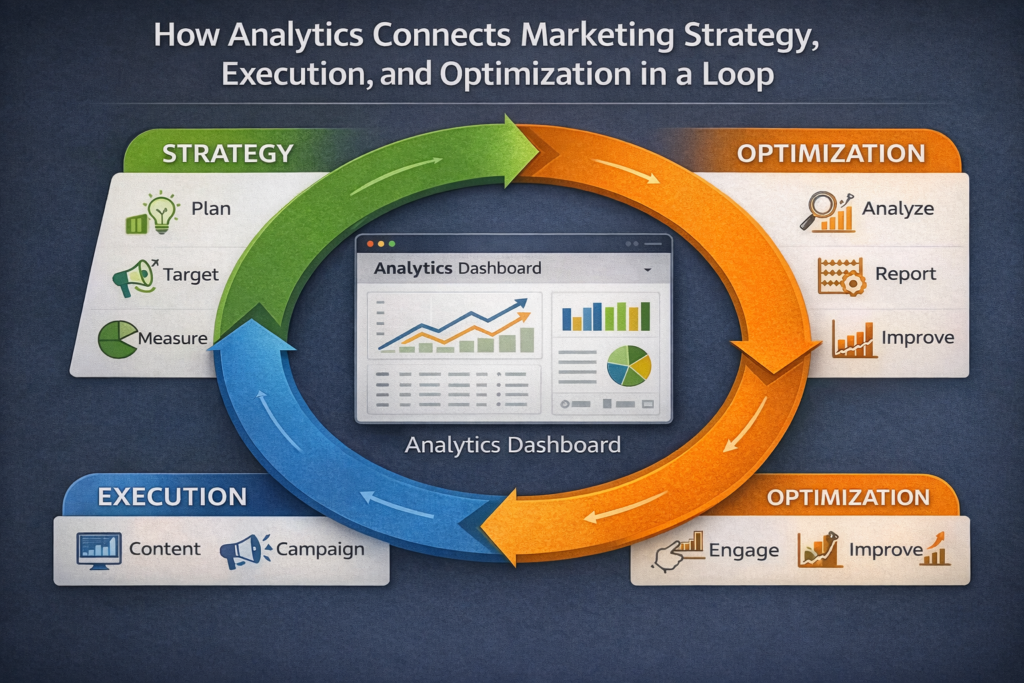
Analytics without strategy is just data. Strategy without analytics is just opinion. The most effective marketing teams treat reporting as a continuous feedback loop not an end-of-month exercise. If you are building or refining your broader digital marketing strategy, make sure your analytics infrastructure is designed from day one to answer your most important strategic questions.
For enterprise-scale teams, the complexity multiplies. Multiple brands, markets, and channels require unified dashboards with granular permission structures. Explore enterprise digital marketing services to understand how to scale your reporting across large organisations without losing clarity.
Frequently Asked Questions
Analytics and reporting in digital marketing involves collecting, organising, and visualising data from channels to understand performance and support data-driven decision-making across campaigns.
Define the main goal, choose KPIs by funnel stage, connect data sources, use a visualisation tool, structure insights, and automate reporting for consistency and clarity.
Track CTR, CPC, ROAS, CPA, conversions, organic sessions, rankings, engagement metrics, and funnel drop-offs to evaluate channel effectiveness and overall marketing performance.
Funnel strategy aligns each journey stage with KPIs, while analytics tracks them, helping identify drop-offs, optimise channels, and allocate budget effectively across the funnel.
Schema markup boosts organic CTR through rich results, indirectly improving analytics by increasing qualified traffic, which enhances session quality and conversion performance.
Review KPIs daily, analyse channel and funnel performance weekly, and conduct detailed monthly reviews to identify trends, issues, and opportunities for optimisation.
Conclusion: Turn Your Data Into Decisions
Analytics & reporting are the engine of modern data-driven marketing. Without a structured dashboard, your funnel strategy is blind you can run campaigns but you cannot truly optimise them. With the right setup, every decision you make is backed by evidence, every budget allocation is justified, and every performance marketing improvement is measurable.
Start simple: one clear question, the right KPIs, and a clean layout. Then build out as your team’s confidence with data grows. The marketers who win are not the ones with the most data they are the ones who build systems that make data impossible to ignore.
If you are ready to take your marketing performance to the next level, get a free SEO report to understand where your current analytics foundation stands and what to fix first.

About the author
Ujjwal Kumawat
I specialize in SEO, website development, Google Ads and online business growth strategies. Through my blogs, I share practical insights, marketing tips and proven strategies to help businesses improve their online visibility, generate more leads and grow faster in the digital space.